Author Archives: James Young

Analysis and Comparison of Ascending and Descending Scales

With added pressure in realizing the semester is half over, as well as an upcoming interview for a position dealing with DSP and machine learning, I came into this week with newfound motivation. The focus that comes with a little bit of pressure is paradoxically quite freeing.

I had some issues when attempting to compare features between audio files. In hindsight, it was an obvious mistake that I had already learned in theory. But of course, applying theoretical knowledge always reveals the points of weak understanding.

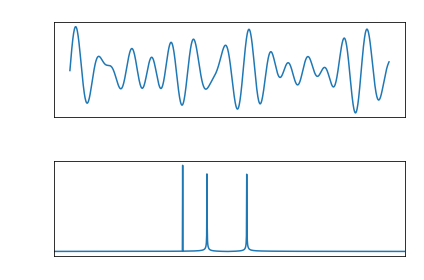
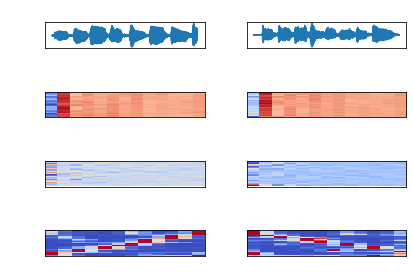
As I’ve written in the past, MFCC (mel-frequency cepstrum coefficients) are most common with speech processing. There are time slices taken from the audio file and by default Librosa calculates 13 coefficients commonly used for speech processing. The MFCC is an array of time slices, each represented by 13 coefficients. These are plotted below, with color representing magnitude (from dark blue to dark red), time slices on the y-axis, and coefficients on the x-axis. The waveform, MFCC Delta, and Chromagram are also plotted.

The chromagram is of particular interest, as it extracts the frequencies in the time domain, revealing that the scale on the left is ascending and the scale on the right is descending. You can even see where my finger slipped playing the descending scale.

Analysis of an ascending and descending scale

This shows the importance of scale invariance when comparing features, which will also come to play in machine learning. This is why frames of equal time-slices, which usually overlap, are taken from an audio sample.

Originally, I was extracting features without cutting the audio files to the same size. This resulted in a larger MFCC. Attempting to plot the difference between the features caused an error. Files with the same length, however, naturally resulted in two arrays of the same size. Because they were only slightly off, I wanted to be sure that my understanding was correct, so I made the ascending scale exactly half the size and ran the program again.

Indeed, cutting the first sample in half reveals that the resulting matrix has half as many MFCC time slices. Librosa extracts the first 13 mel-frequency coefficients, so each array will be length of 13 and each time slice will have one of these arrays. Trying to find the difference by subtracting one matrix from another results in this error message:

ValueError: operands could not be broadcast together with shapes (44,13) (87,13)
Analysis after cutting the ascending scale in half

Also notice the chromagram only reveals 4 major frequencies. And because a chromagram is in the time domain, but the plot still has the same x-axis, the notes end at approximately the halfway point.

Plotting the absolute difference between MFCC features may not be visually illuminating, but potentially has uses for pattern identification. The real utility comes from comparing an audio sample to existing files. Take a look at the ascending versus ascending scales:

The absolute difference in MFCC features between ascending and descending scales

There is little difference in the higher coefficients, but some strong differences in the first coefficient. There are irregular differences through the rest of the plot, both in time and within coefficients. In isolation, this doesn’t reveal much. But when instead comparing two ascending scales offset by 0.1 seconds, the differences are very small. There are regular spikes in the first coefficient however, likely due to the earlier change of note in one sample.

The absolute difference in MFCC features between ascending scales, offset by 0.1 seconds

This lack of difference is one example of how a machine learning algorithm can detect whether a audio sample fits into a group. Actually training these models will be the topic for next week.

From the blog CS@Worcester – Inquiries and Queries by James Young and used with permission of the author. All other rights reserved by the author.

Reflect As You Work

This apprenticeship pattern caught my eye for discussing the Peter Principle, which states that an individual will only be promoted if they do well in a position. The result of this is an organization full of people who have been promoted to positions in which they no longer perform well, creating an incompetent organization.

Reflecting as you work is meant to prevent this. The idea is simple enough: constantly probe your work process and ask yourself whether it is ideal. Take note of the positive aspects, but also the negative aspects so that they can be fixed.

The pattern suggests focusing on increasing skill rather than experience. This is a subtle but important distinction, because spending a lot of time doing a single thing wrong is still a lot of experience, but it’s not necessarily useful as a professional.

In certain parts of our industry,
it is quite easy to repeat the same year of experience 10 times without making significant progress in your abilities.

Apprenticeship Patterns

I certainly reflect on my work when it’s done, but I tend to focus on the work itself rather than the process. I’ve spent countless hours before a project commit making sure every line of code is perfect and the necessary documentation is in place. This led to nice code and happy professors or managers, but it didn’t help my work process. It was doing more of the same; obtaining a good result, but without improvement in workflow.

Figuring out how work processes connect is a helpful practice to identify counterproductive habits. We tend to take the path of least resistance and easily fall into a workflow that we assume works best for us, but this may be an illusion due to our limited scope of experience. We know redundancy can be reduced within a project’s architecture. We strive for this. Why then, would we not give our work process the same courtesy?

This pattern is a great example of software development’s being more than simply writing code. And by writing code, I mean using tests, DevOps, OOP, and anything else that can be considered a software engineering practice. As the entire book aims to prove, software development is an organic, human process. Moving from a software apprentice, to journeyman, to master requires understanding your own flaws, not just the flaws in your product.

From the blog CS@Worcester – Inquiries and Queries by James Young and used with permission of the author. All other rights reserved by the author.

Creating Chords from Sine Waves in Python

This week as part of my independent study I worked on feature extraction in Python. I have been using Python for Engineers as a reference, and it describes basic digital signal processing. As an exercise, I expanded on the code found in that chapter.

It’s a non-trivial task to create a sine wave in code (although compared to the most complex aspects of DSP, it’s a cakewalk). A sine wave will create the purest tone possible, as it creates a constant oscillation. This oscillation is what you perceive as a pitch. The equation for a sine wave is given as:

y(t) = A sin(2πft + φ)

where A is amplitude, f is the frequency, t is time, and φ is the phase in radians. We can ignore phase because this simply indicates where the wave starts at t=0, and this doesn’t matter to our ear. We hear the same oscillation regardless of where it starts.

Take a look a the code for creating a sine wave. Some of the details aren’t as important, but you can see the book for a description. The line that actually creates the sine wave values is:

sine_wave = [np.sin(2 * np.pi * frequency * x/sampling_rate) for x in range(num_samples)]

If you aren’t familiar with list comprehension in Python, this is just using the sine wave equation above, substituting time, t, as a specified number of samples divided by the sampling rate. The result is a list of values representing a sine wave. In reality, this is all an audio file is, with some additional encoding (and usually more interesting oscillations than a sine wave).

So what if we wanted to do this for a chord of multiple sine waves? Maybe using more list comprehension? Sure.

# Note Frequencies
a4 = 440
c5 = 523.25
e5 = 659.25
chord = [a4, c5, e5]

sine_waves = [[np.sin(2 * np.pi * freq * x/sampling_rate) for x in range(num_samples)] for freq in chord]

This is doing the same as above, only it’s doing it for each frequency in a list of frequencies. But that’s the easy part. The original code just multiplies the samples by the amplitude, then converts them to hexadecimal values and writes it to the file:

for s in sine_wave:
    wav_file.writeframes(struct.pack('h', int(s*amplitude)))

But we can’t simply do that for each sine wave in succession, or we’d get different sine waves playing one after another. That’s an arpeggio, not a chord!

So we have to get a little creative. But not too creative. If you think of each sine wave playing from a separate speaker, what you hear is the sum of the air pressure from each speaker. A single speaker is the same story: it’s just playing the sum of the three sine waves. So then, iterating through each index, we can add the amplitudes of each individual sine wave. I also had to reduce it enough to store the value as a short int, by dividing by two.

# Only write samples to the end of the shortest sine wave
shortest_sample_len = min([len(j) for j in sine_waves]) 
for i in range(shortest_sample_len): 
    current_frequencies = [wave[i] for wave in sine_waves]
    value = sum(current_frequencies) / 2
    wav_file.writeframes(struct.pack('h', int(value*amplitude)))
Output of the sums of the sin waves before multiplying by amplitude

Python for Engineers goes on to describe how to use a Fast Fourier Transform to get the frequencies from the wave file with a single sine wave. But the code works just as well for the sine wave chord! This is because the FFT is an array that treats each index as a frequency, and the value at that index is the frequency’s amplitude. This means that regardless of the number of tones in a sample, the FFT can be plotted and will reveal outliers: those indices with a much higher amplitude. These are the frequencies in the audio file.

One last thing to keep in mind is that since the indices are used to represent the frequencies, they will be whole numbers. For example, c5 = 523.25hz will show up as a spike at indices 523 and 524, which 523 having the larger value of the two.

Output of finding the frequencies of the chord created above

Full code for creating a chord in Python is posted here.

From the blog CS@Worcester – Inquiries and Queries by James Young and used with permission of the author. All other rights reserved by the author.

Be The Worst

I love this apprenticeship pattern. It immediately caught my attention, and although I knew exactly what it was getting at by reading the title, it’s a great reminder.

We’ve probably all heard the phrase “if you’re the smartest person in the room, you’re in the wrong room”. That’s what this pattern is describing. As the worst on a team, you will have an occasion to rise to, riding on the coattails of your teammates and becoming better for it. This means harder work. It requires the ability to apply many other patterns described in the book to succeed efficiently.

The above quote is a bit harsh, though, and isn’t mentioned in the book. It’s not that one should be openly criticizing their coworkers or consider themselves the smartest person in the room, despite every programmer’s periodic God complex. Besides, it’s difficult to ascertain who exactly is the smartest, or best developer, or best employee. There are many metrics and a team is full of people with different strengths and weaknesses. The individuals are less important than the group: this pattern is probably best implemented by looking at teams as a whole. Are your skills lower than those of the group as a whole? This could be caused by a lot of great developers not working well together. This, too, will slow your progress down. This, too, is a reason to change.

I have mixed feelings about this sentiment. It’s patently true that working with people significantly above your skill level will help you improve if you’re willing to put the work in. But it would be a real shame to leave a close, efficient team just because you’re no longer worse than all of them.

But that is an important part of growth: knowing when to move on. Finally ending my college career makes me consider all the things I could have done, or could do if I finished a second concentration or major. Or what I missed for general education credits, extra curricular activities, and social experiences by cramming the entire degree into three years and not taking my time to enjoy it. It’s nearing the time to move on, though. Despite a connection to classmates and professors, it would not be wise to stay longer. This doesn’t mean professional or academic relationships have to end, but the majority of my time will soon be spent improving in my chosen career, with new challenges, on a new team.

From the blog CS@Worcester – Inquiries and Queries by James Young and used with permission of the author. All other rights reserved by the author.

Independent Study: The Plateau, the Snag, and the Obstacle

Researching more on audio feature extraction last week gave me a lot to think about. As it settled in, I came up with great ideas for hypothesis to test and specific applications for them. The kind of ideas that lead to turning off your cell phone, skipping lunch and dinner, and get things working.

Unfortunately, as mentioned last week, I do not have the time learn audio processing algorithms to the extent that I can implement them, so I will have to make a choice on a library that will help. A further complication was getting code to run in Android. Libraries exist to run Python code in Android, but the Python libraries I’ve found for audio analysis are lacking in features and I would need to use a combination.

The most comprehensive library I’ve found is Essentia. Of course, it’s so comprehensive I won’t be able to use the code for a professional app without a commercial license. Luckily there is a noncommercial license available that will allow me to get results for the project and determine if there are commercial applications.

Essentia is a C++ library. So the good news is I get to use JNI and the Android NDK (Native Development Kit) to run C++ code. Getting C++ code to run from an Android Activity is straightforward enough, but I do worry about potential complications in running Essentia. There are a number of dependencies that I fear might cause trouble with a feature I might want in the future. These are kept to a minimum with a special flag during compilation for Android. But alas, my paranoia strikes.

Because Essentia is open source, I am at least able to see implementations of the audio processing algorithms, and the code is well-documented with references to studies. Signal processing is a degree, not just a semester-long project. I certainly appreciate that fact more over the past couple of weeks. But this will be a great overview and using the code will still require understanding of the underlying processes.

Progress was made on converting files from audio to basic byte data. When I was considering Python libraries, I was under the assumption I could use WAV files and easily get byte data (for example, with librosa). Android’s MediaRecorder doesn’t support saving WAV files, so other formats must be used.

From the blog CS@Worcester – Inquiries and Queries by James Young and used with permission of the author. All other rights reserved by the author.

Use Your Title

The next apprenticeship pattern I was drawn to has to do with the imposter syndrome. The problem comes when you obtain a title that doesn’t seem to reflect your skill level, at least in your mind.

The description of the pattern is much different than my expectation. I had imagined using a title to advance your career, but the suggestion is quite the opposite: it posits that the title is ultimately pretty meaningless as far as your skill level, but you can use it to gauge your employer.

An impressive title is tempting to pursue. It seems to prove to others that we’ve achieved success, which can be tempting for someone with parents to make proud or neighbors to keep up with. This can be completely removed from your actual success and may not reflect your actual job duties. While not explicitly stated in the book, this pattern suggest that if a company sets your title to something prestigious, and you don’t agree with it, it might be possible that the company sets the bar too low. If you know your skill is below a senior engineer, you should be somewhere where the senior engineers will help you get to their level. That’s not possible if all the senior engineers are at your level and know you don’t have the skills.

I’ve always reached out of my job title, as suggested by the Draw Your Own Map pattern I wrote about last week. As such, my job title did not reflect what I was actually doing. “Use Your Title” says that this can tell you whether you are appreciated, and reflects your employer more than your skills, and this has led me to leave jobs before.

I did have some problems with this pattern. It seems a bit contradictory, saying to not let your title affect you, but then saying to use it to decide how you feel about your company. Regardless, it sparked some thought about how I will be perceived and will help me to consider how my employer feels about me in the future.

I’m going to admit ignorance here: I don’t understand how the suggested action ties in with the description of this pattern. It says to write down a long, descriptive job description and consider how others would perceive you upon reading it. While this exercise might be useful, I don’t see how it applies to “using your title”. My only guess is that you want your actual title to match as closely as possible to your own goals. When there is a mismatch, for better or worse, it might mean you are not aligned with your company.

From the blog CS@Worcester – Inquiries and Queries by James Young and used with permission of the author. All other rights reserved by the author.

Audio Feature Extraction

This week I’ve continued working on the application part of my Android application, but I’ve also started to “dig deeper” (apprenticeship pattern blog post coming soon) and learn a bit more about audio processing.

I started with general concepts of feature extraction a couple of months ago now. Understanding how to use Python libraries to extract features is simple enough, but actually understanding how they work and why they work is another story. This week’s research has revealed an underlying elegance to the concept of signal processing and helped me reach a higher level of understanding and excitement for this project.

The single best explanation has been a video by Youtuber 3Blue1Brown on Fourier Series. I recommend all of his channel because he has an elegant way of describing and visualizing every topic he speaks about. He helped me understand the beauty of Calculus, and in my process of digging deeper I wound up watching his video on the uncertainty principle which was surprisingly relevant to signal processing. Understanding the specifics of the math behind signals and waves, and knowing the fact that mathematical equations are a language used to describe straightforward physical phenomena is key. This knowledge makes daunting concepts easier to break down. Seeing the same concepts used in different contexts also helps solidify them in your mind. And if you’re implementing this in code, it will make it much easier to remember the necessary logical steps required to extract a feature.

This entire tangent (and however useful, it was an unexpected tangent) started with trying to better understand the types of feature extraction that are used in speech recognition. By the way, you know you’re digging deeper when an article with an estimated read time of 11 minutes takes you a few hours to get through with all the additional research.

And universally, as far as I can tell, the first step in signal processing and feature extraction is the Fourier transform, which is simply turning a raw audio signal into separate sine and cosine signals. I say simply, but as the 3Blue1Brown video states, this seems a bit like figuring out which colors make up a mixed up can of paint. It turns out, however, that clever math makes it quite obvious which summation of sine and cosine signals make up a complex signal. I encourage you to watch the video to understand why.

The summation of cosine and sine waves is considered the frequency domain, while the original signal is in the time domain. From the resulting frequency domain, the individual signals can be normalized by taking the log magnitude of the signals and performing an inverse Fourier transform.

This is a new concept called a cepstrum, and it is one of many possible transformations you can make on a signal to begin to analyze the data. Its usefulness comes from the ability to see changes in individual waves. Additional operations can be performed to reveal new insights into patterns in a signal. Determining which if these works best is part of the process.

These individual transformations would be very interesting to implement in code. I may not get a chance to do so for this project, but the understanding of the underlying operations will help in using existing libraries.

From the blog CS@Worcester – Inquiries and Queries by James Young and used with permission of the author. All other rights reserved by the author.

Capstone Sprint 1 Retrospective

With our first sprint under our belts, our team is excited to dive into more advanced features. A majority of this sprint was spent learning some new technology, getting our heads around the project’s documentation and workflow, as well as learning to work as a team. However, we also made some strides in implementing our final product.

My contributions

Discussion about whether an issue was a duplicate or if it was a typo, and subsequent editing of the issue.

Commenting with documentation for date format for future reference, which occurred during an in-person discussion.

Request to take care of an issue that was already assigned, in an attempt to complete the tasks at the top of the board first.

Opening an issue that was discovered while committing with a new .gitignore file.

Reviewing and marking an issue to find approved colors and logos as done after completion.

Implementing a stub and merging after approval.

Discussing issues during approval of another feature and merging manually.

Retrospective

As a team and individuals, we are all excited about this project. We all bring our own interests, skills and knowledge, which come with our own quirks and blind spots. This occurs on any team, but it is nice to acknowledge this in ourselves and in our teammates so that we can become more willing to spot them in each other. This allows us to delegate work that we need, ask for help when we need it, and call each other out when we are going down a rabbit hole that is a dead end. I may be the worst offender in this, because I would sometimes slow myself down getting caught up in unnecessary details. I wouldn’t resent my team for telling me I’m worrying too much. I personally feel I could also be better at describing what I’m worrying about.

This experience during this sprint opened up a possibility for improvement for our next sprint planning: more detailed descriptions of “done”. Being new to the format, we tried to shoehorn our issues into a standard template that we were provided. Using only the “given, when, then” Gherkin format, we didn’t get a chance to fully express what we wanted done. Elaborating more in the initial issue will help our focus and prevent worrying about adjacent, unrelated issues, solely due to thinking about each problem in more detail. For example, our stubs didn’t include any testing as part of the definition of done, but luckily we felt that this was reasonable and included them, rather than creating a new issue. I am of the opinion that for software to be complete, some testing should be associated with it. We will create a nightmare down the line if we aren’t careful with this, and should be more clear when defining our issues.

Much of our work was also done as a team, together in the same room. This forced us to remember to document our discussions and decisions in GitLab after the fact. We could have been more diligent in this regard. Although many of the solutions seemed obvious to us, documentation on our reasoning could be important for future developers. I enjoy working in person with a team because it facilitates quick discussion, but I feel we should either discuss more over GitLab or hold each other accountable for documentation after a decision is made as a team.

We are all feeling pressure to finish something we are proud of by the end of the semester. I think this contributed to some of the worrying and long discussions we had on features.

Making matters worse, was that other teams were likely having the same issues we were in adjusting to the new project. I think we handled this rather well and had some good back-and-forth about API design and the features we were planning on finishing. Again, this could have been better documented on GitLab for future reference. Some of this occurred in Discord, and will be lost in a sea of other messages. The less-obvious decisions were luckily documented in GitLab, such as the design of the ApproveGuest Module API. I would have liked to see more back-and-forth between our two groups in the discussion, instead of an abrupt approval of the feature.

This was a short sprint with an emphasis on learning, so thankfully we will be able to improve on these issues and focus on our strengths in the next longer sprint, which should get us close to a working product.

From the blog CS@Worcester – Inquiries and Queries by James Young and used with permission of the author. All other rights reserved by the author.

Draw Your Own Map

This week, I’ve been thinking about an apprenticeship pattern that brought up something I had never considered. It opens with a quote suggesting people might say programming might not be sustainable in the long-term. News to me!

The crux of this pattern is that you won’t always be provided with the career path that you want. To be successful, you have to fight the urge to follow the path an employer gives you and take steps toward the path that you want. This is your map, and it can be redrawn at will. The goal is not to narrow your experience just because of a comfortable salary and your attachment to a fancier title.

This pattern seems to stem from the loss of many great developers to the world of management. The author seems a bit biased in wanting to prevent this. Unfortunately, many people might find their salaries necessary to maintain a lifestyle, or support a family. Furthermore specialization, or “narrowing” as they describe it, can be a good thing.

Of course, if narrowing is part of your map, I suppose it still fits with the pattern. But the book also suggests looking at the possibilities, which I agree with. After all, a map doesn’t have one path; it has many from which to choose. Listing many potential paths and following the one that looks best for you is likely a good tactic to get where you’d like to be in your career.

I’ve always felt a pressure to choose a single path and stick with it. Being able to change my mind is a nice idea. Luckily as far as I know now, I’ve mostly figured out my career path, but I will also follow the suggestion of the book to plan many alternatives. Experience in multiple different positions has given me insight into the aspects of each job I like. With this knowledge, I’m only interviewing at positions that I trust I can stay with long term, and I’ll only accept a position if I still believe that’s the case. Nevertheless, the rest of my career is a long time, and companies change.

The quote at the beginning of the chapter is meant to say that if people tell you to stick to one thing — to move to the safe, normal career path — you don’t have to. If a company prevents your own professional growth, it’s time to jump ship.

From the blog CS@Worcester – Inquiries and Queries by James Young and used with permission of the author. All other rights reserved by the author.

Android Audio Recording and Playback, and an Animation False Start

This week, I spent a lot of time with animations in Android. And yet, I still could not get transitions to work to my liking. After reading Android’s docs, I resorted to a few different videos and tutorials, some of which seemed straightforward but were using methods of Android past.

The goal was to animate the title of a single audio file in a list, to move to the top of the screen and become a heading for details about that file. Animations are easy enough if you’re transitioning between Activities. But it appears that having a RecyclerView in a Fragment to list audio files adds some complications. I did successfully animate between the screens, but the first item in the RecyclerView’s list was animated, and it abruptly changed to the correct title when the motion ended. The issue is that this transition animation requires two elements to have a shared “transitionName”. Because I am using Card objects to display each of the audio files, only one Card can use that transitionName and be animated.

The solution is to set the name in the RecyclerView’s ViewHolder, so that when objects are bound to a specific card, they can get a unique transitionName. This can then be applied to the Fragment’s View before the animation begins. Attempts to do this caused some problems due to Android’s Lifecycle. Many a blog post have been written on this subject, but I’d like to discuss it in the near future to gain a stronger understanding.

All of this is to say: I want to efficiently getting from point A to point B by realizing which subjects and features are most important. Understanding the Android Lifecycle is clearly more important than an animation, and apparently prerequisite knowledge. And recording and playback are at the heart of the app itself. So my progress in animation is stashed in Git and ready for me to continue once I accomplish these other tasks.

Luckily, getting audio to record and play back was a much more enjoyable process. This might be due to my greater interest in the feature, but I was able to break down the problem and troubleshoot issues much easier.

I erroneously believed that my simple spike project would easily translate to my app. Android’s guide to MediaRecorder and MediaPlayer made it simple to get something quickly up and running. However, using their code directly would create a nightmare of an Activity, which neither properly separate concerns nor follow basic OOP principles. Furthermore, I needed the recording to begin immediately upon opening a new “RecordActivity”. This caused some issues with Android’s lifecycle, so I took to opportunity to explore that. The problem came from trying to start recording in onCreate(), which did not provide enough time to load the MediaRecorder into memory. The solution was to start recording on the onResume() event. However, this may be called more than once in the life of an Activity, so I simply check if the MediaRecorder is currently recording, and start recording if it isn’t.

I spent a bit too much time trying to find the recorded audio files in phone’s physical storage. It seems they do not appear, and I haven’t found a good explanation for this. Luckily, Android Studio’s Device File Explorer did reveal that the files were saved and properly recorded audio.

From there, implementing audio playback as a Service (which in Android is essentially an Activity without a UI) was rather smooth. This also allows playback to be initiated from anywhere in the app by passing the file name in a single line of code.

I have always been a function-over-form kind of guy. I made significant progress on the app this week in the function department. Hopefully the form will come in time.

From the blog CS@Worcester – Inquiries and Queries by James Young and used with permission of the author. All other rights reserved by the author.